
















































Here are a few tricks of the trade accumulated by your friendly aircraft dispatcher, plus a few contributed by another dispatcher, a friend of mine! I hope they help in your flight experiences, so pass them on to help your fellow aviation lovers. I have sorted these into two main categories related to dispatch: weather and operations.
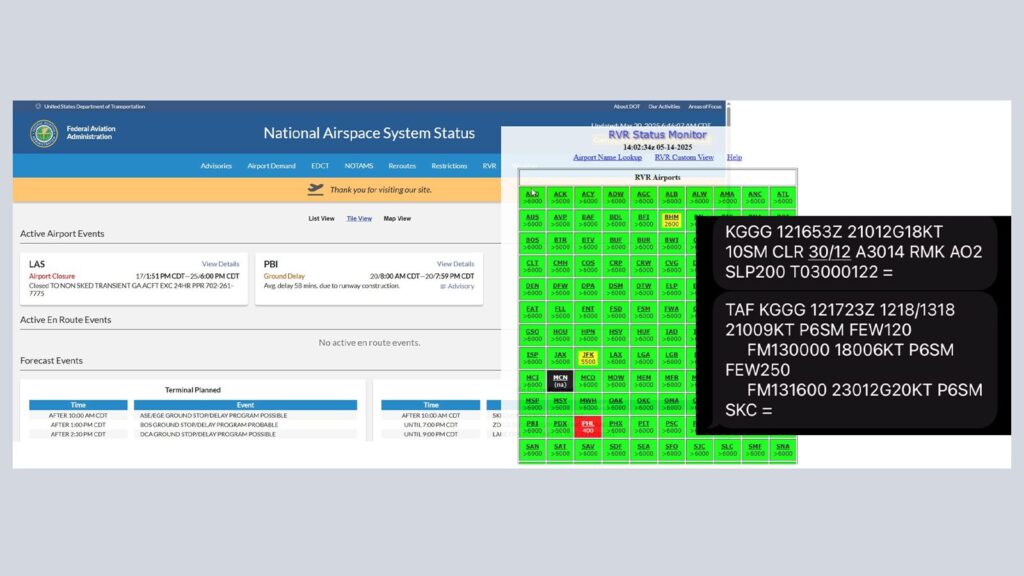
To quickly get a METAR and TAF, text the following to 358-782 (FLT-SVC): MT KZZZ (whatever airport or airports you want). Or if you just want a METAR or TAF, just send M KZZZ or T KZZZ respectively. You’ll get a fast reply that is also easy to copy, paste and to someone else. To really cheat, add PT to the end, and it will translate into plain text. (MT KZZZ PT)
Regularly updated video weather briefings are available for every center in the United States here: https://aviationweather.gov/pdwb/ The videos are usually 2-4 minutes long and a nice little outlook of the weather for that region for the day. These are watched by controllers when reporting for duty.
Forecast discussions are excellent for going a bit deeper into the TAF and for meteorologist rationale when written. For example, sometimes they don’t include thunderstorms in the TAF due to low probability, but the area in question still has thunderstorms possible. To communicate this, they add it to the forecast discussions, available here: https://aviationweather.gov/gfa/#afd






Of course, Windy and SkyVector are always handy, SkyVector especially so because you can make your route and overlay weather, but you can also make a route and overlay weather on AviationWeather.gov on their main observations map using the “Flight Path” tool on the right-side top menu.
For better satellite views also outside the United States, check out the College of DuPage: https://weather.cod.edu/satrad/?parms=gulf-04-24-0-100 The TCF is what ATC utilizes for convection prediction that is likely to impact traffic flow: https://aviationweather.gov/tcf/ so it’s nice to have a look at what they are using. Getting deeper into convection forecasts, check out LAMP https://lamp.mdl.nws.noaa.gov/lamp/cnvltg.php for convection probability.
I love this customizable tool for RVR at a glance: https://rvr.data.faa.gov/ and click “custom view” from the top menu to set up your favorite airports to monitor. It defaults to a collection the FAA thinks you’d like to see, but pick your list and let it update for you in near real-time.
It’s helpful to check the FAA’s ATSCC site for the operations plan, see what ground delay programs or ground stops are in effect, and review routing restrictions. Their site is at https://nasstatus.faa.gov/ which also lets you use the EDCT lookup tool—so handy for checking your flight’s assigned delay (top menu) and also look up the FAA’s SWAP routes using the Playbook (bottom link).
This site also lets you check airport demand to see how many arrivals can be accepted each hour and how many flights have planned to the airport—again to help predict where flow control programs might be implemented. As mentioned, this site shows you the ops plan (scroll below “Forecast Events” which is updated many times daily and includes items like VIP movements, space launch activity, expected and current delay programs plus the reason and the probability of extension.
Finally, for fun, check out www.badbadweather.com which is an accumulation of the worst weather around the world, automatically accumulated and displayed. Where’s the highest gust in the world at this moment from all the METARs? As I write this, it’s at ENUG (Enugu, Nigeria) currently gusting to 62 knots! Bad Bad Weather is great for quizzing yourself on reading METARs and general wasting time while waiting during a weather (or other) delay on your next flight. It must be worse somewhere other than where you currently are, right?