


















































Every professional pilot is accustomed to the routine: plug the weights into the FMC, verify the V-speeds, and brief the departure. But while our computers are excellent at crunching numbers, they are notoriously tight-lipped about the “why” behind the data. When the runway gets shorter, the pavement gets contaminated, or the threat of windshear looms, the underlying physics of takeoff performance can shift in ways that feel counterintuitive.
In this analysis, we take a Boeing 737-800 out of Hartsfield-Jackson Atlanta (KATL) to see how varying conditions impact our safety margins. The aircraft’s weight and balance information are as follows: 2-pilots, 4-flight attendants, 130-adult passengers, ZFW 120.6, GTW 136.3, and Takeoff CG 22.4%. The weather is 15°C, calm winds, and an altimeter setting of 29.92 inches. Takeoff calculations are performed from three runways, i.e., RWY 8L (TORA 9000 ft), RWY 8R/E3 (TORA 7749 ft), and RWY 26R/B11 (TORA 6450 ft), and four scenarios, i.e., normal (thrust optimized), windshear, 1/8 inch standing water (contaminated runway), and a combination of both windshear plus 1/8 inch standing water. These results are summarized in the table below:
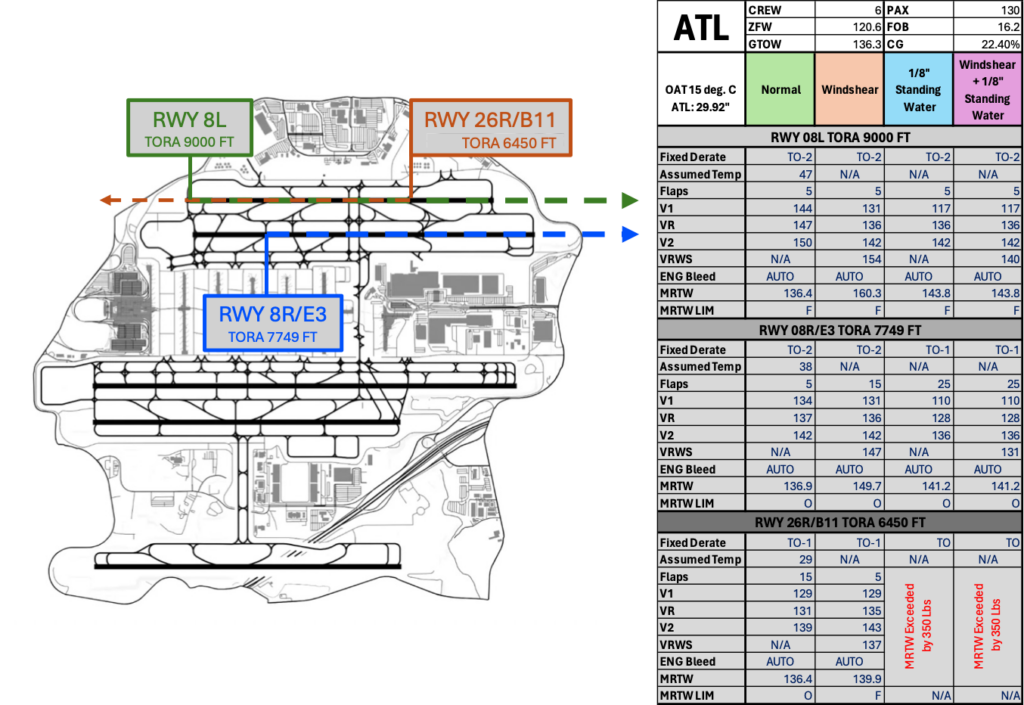
By comparing normal (thrust optimized) settings against windshear, 1/8 inch standing water, and the combined scenarios, we can see exactly how the aircraft’s performance capability and limitations evolve. It isn’t just about whether the aircraft can fly, it’s about understanding the trade-offs between fixed derates, assumed temperatures, flap settings, and V-speeds. Our performance calculations are data-driven, but do we truly understand the data? Let’s put your technical knowledge to the test and look past the FMC display to the aerodynamic realities of the takeoff roll. Test your knowledge by trying to answer the questions below:
Q1: Why is it optimum to use a derated with an assumed temperature for RWY 8L under normal conditions?



Q2: The MRTW for RWY 8L is 136400 lbs., but the MRTW using windshear performance data is 160300 lbs. What factors account for this 23,900 lb. increase in performance capability?
Q3: Why did the Assumed Temperature and V1 decrease for RWY 8R/E3 when compared to RWY 8L under normal conditions?
Q4: Why is the Windshear VR (WSVR) lower for a contaminated runway vs. a dry runway?
Q5: Assume RWY26R/B11 is the only available runway for departure. What are some options to obtain performance numbers and manage the MRTW exceedance by 350 lbs.?
Answers for questions Q1–Q5:
While the aerodynamic and regulatory logic behind these calculations is deeply technical, let’s look at the practical implications from the flight deck:
Q1: Why is it optimum to use a derated with an assumed temperature for RWY 8L under normal conditions?
Using a Fixed Derate combined with an Assumed Temperature is considered “optimum” because it minimizes engine wear and maintenance costs while still meeting all safety requirements.
- Engine Longevity: Reducing thrust lowers the internal operating temperatures and pressures of the engines.
- Performance Matching: RWY 8L is the longest runway (9,000 ft), providing ample distance to accelerate even with reduced thrust.
- Weight Alignment: The Maximum Reduced Takeoff Weight (MRTW) of 136.4 (136,400 lbs.) is almost identical to the aircraft’s actual Gross Takeoff Weight (GTOW) of 136.3 (136,300 lbs), meaning the thrust has been perfectly “dialed down” to the minimum necessary for a safe departure.
Q2: The MRTW for RWY 8L is 136,400 lbs., but the MRTW using windshear performance data is 160,300 lbs. What factors account for this 23,900 lb. increase in performance capability?
The massive jump in performance capability (from 136,400 lbs to 160,300 lbs) is primarily due to the removal of thrust reductions.
- Full Rated Thrust: While “Normal” operations use TO-2 and an assumed temperature of 47°C for this scenario, the windshear calculation uses TO-2 derated thrust with no assumed temperature.
- Performance Priorities: Windshear performance data is designed to maximize the aircraft’s ability to “fly out” of a detrimental environmental condition (e.g., microbursts, gusty wind conditions, and windshear conditions). This often involves utilizing the full-thrust capability of the engines and optimized climb profiles that would be unnecessarily aggressive (and expensive) for non-threatening environmental operations.
Q3: Why did the Assumed Temperature and V1 decrease for RWY 8R/E3 when compared to RWY 8L under normal conditions?
These changes are a direct result of the shorter runway length (7,749 ft. for 8R/E3 vs. 9,000 ft. for 8L).
- Assumed Temperature (47°C vs 38°C): A shorter runway provides less distance to accelerate. To reach takeoff speed safely before the pavement ends, the aircraft needs more actual thrust. Therefore, you cannot “trick” the engine into thinking it is as hot (47°C); you must use a lower assumed temperature (38°C) to produce higher engine output.
- V1 (144 kts vs 134 kts): V1 is the “decision speed.” On a shorter runway, you must be able to stop the aircraft within the remaining distance if an engine fails. A lower V1 ensures that if you abort the takeoff at that speed, you still have enough runway left to come to a complete stop.
Q4: Why is the Windshear VR (WSVR) lower for a contaminated runway vs. a dry runway?
The Windshear VR (rotation speed) is reduced on contaminated runways (e.g., 140 kts. vs. 154 kts. on RWY 8L) to get the aircraft airborne sooner.
- Rolling Resistance: Standing water increases drag on the tires (friction), making it harder to accelerate to high speeds on the ground.
- Flap Configuration: To compensate for the contamination, the aircraft often uses a higher flap setting (e.g., Flaps 25 for contaminated vs. Flaps 5 for dry). Higher flaps create more lift at lower speeds, allowing the aircraft to lift off the ground earlier to avoid the performance-sapping effects of the water. However, the added parasitic drag with a higher Flap setting significantly degrades the aircraft’s climb gradient, particularly in an engine-out scenario (One Engine Inoperative – IOE).
Q5: Assume RWY26R/B11 is the only available runway for departure. What are some options to obtain performance numbers and manage the MRTW exceedance by 350 lbs.?
If RWY 26R/B11 is the only option and the MRTW is exceeded by 350 lbs. due to standing water, the crew must find a way to either increase performance or decrease weight.
- Offload Weight: The most direct solution is to remove 350 lbs. of payload (approximately 2 passengers or a small amount of cargo/fuel).
- Wait for Better Conditions: If the standing water clears or the runway becomes “wet”, the MRTW would likely increase enough to cover the gap. A headwind or decrease in air temperature from a frontal passage will also aid in improving takeoff performance.
- Bleeds OFF Takeoff: The table shows Engine Bleeds in “AUTO”. Switching engine bleeds to “OFF” for takeoff provides more thrust to the engines, which can significantly increase the MRTW.
- Select a Different Flap Setting: Depending on the specific aircraft manuals, a different flap setting (if available) might offer a better climb gradient or shorter field-length performance.
Ultimately, takeoff performance is more than a set of speeds to be cross-checked during the Before Start Checklist. Takeoff performance data is a complex balancing act of physics, regulation, and environmental reality. While our modern flight management systems are incredibly capable, they are only as good as the pilot’s ability to interpret the output. Understanding why a shorter runway demands a lower V1 or how 1/8″ of water can trigger a 350-lbs. weight penalty is what separates a “button-pusher” from a master of the aircraft. As we continue to operate in challenging environments, staying curious about the “why” ensures that when the numbers don’t add up or the conditions deteriorate, we have the technical foundation to make the safest command decision.